Monitorando a Floresta Amazônica
A distribuição
dos novos desflorestamentos, por classe de tamanho, é utilizada
por órgãos governamentais e não-governamentais como um indicador
das possíveis causas do desflorestamento na Amazônia. A Figura 8
apresenta a distribuição da taxa média do desflorestamento (% /
ano) por classes de tamanho. As Figuras 9 a, b, c, d, e, f, g apresentam
a distribuição da taxa média do desflorestamento bruto para os anos
1995, 1996, 1997, 1998 e 1999, para as seguintes classes temáticas
de fisionomia florestal: formações pioneiras, campinarana florestada,
cerradão, região de contato, floresta estacional, floresta ombrófila
aberta e floresta ombrófila densa, respectivamente.
|
.... |
Monitoring
the Brazilian Amazon Forest
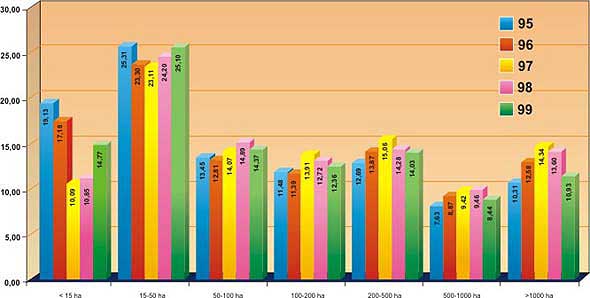
The
distribution of the deforested areas by classes of size is used
by governmental and non-governmental agencies as an indicator of
the possible causes of deforestation in the Amazon. Figure 8 presents
the distribution of the mean rate of deforestation (% / year) by
classes of size. Figures 9 a, b, c, d, e, f and g, present the distribution
of the mean rate of gross deforestation for years 1995, 1996, 1997,
1998 and 1999, for the following thematic classes: early primary
succession communities; Amazon white-sand woodland; dense savanna
woodland; contact zone; seasonally deciduous tropical forest; open
tropical rain forest and dense tropical rain forest, respectively.
|