|
Monitorando a Floresta Amazônica |
.... |
Monitoring the Brazilian Amazon Forest |
_____________________________________________________________________________
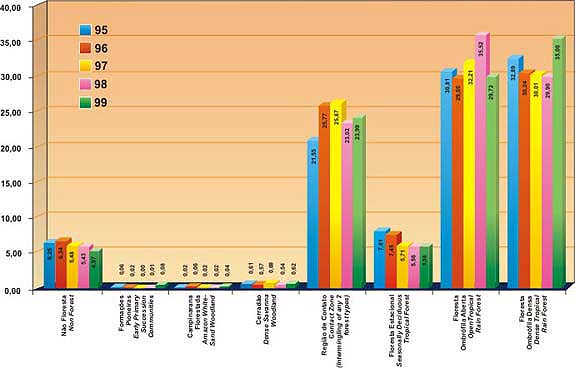
Figura 7 - Distribuição da taxa média do desflorestamento bruto (% /
ano)
* por fisionomia florestal, de 1995 a 1999.
Figure 7 - Distribution of the mean rate of gross deforestation
(% / year)
* by forest physiognomy, from 1995 until 1999.
|
 |
|
|
* Relativo à taxa média anual para a Amazônia.
|
|
|
 |