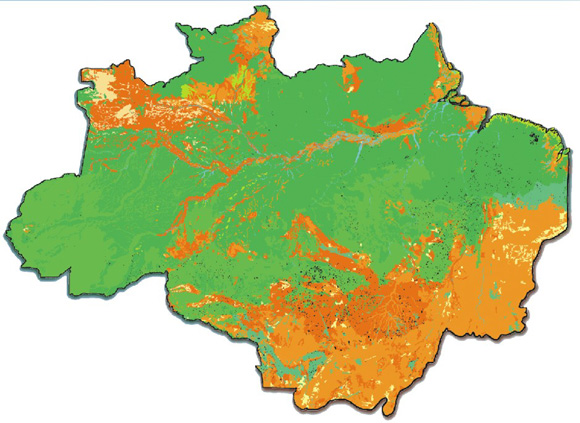
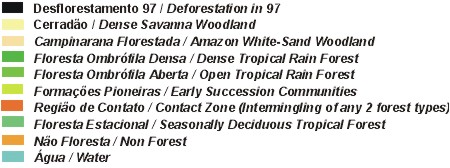
Incrementos do desflorestamento
observado em 1997 sobre o Mapa de Vegetação do Brasil (FIBGE).
Increments of deforestation
observed in 1997 overlaid on the Brazilian Vegetation Map (FIBGE).
![]()
![]()
| Monitorando a Floresta
Amazônica
O PRODES, além de fornecer estimativas da
extensão e taxa
Adicionalmente, os dados do PRODES
são sobrepostos ao
|
Monitoring the Brazilian
Amazon Forest
PRODES, in addition to the extent and rate of gross
deforestation, provides the spatial distribution of critical areas in the
Amazon. For instance, in 1997, more than 75%
of the deforestation was concentrated
in 46 of the satellite images analyzed. PRODES data
|
Incrementos do desflorestamento
observado em 1997 sobre o Mapa de Vegetação do Brasil (FIBGE).
Increments of deforestation
observed in 1997 overlaid on the Brazilian Vegetation Map (FIBGE).
![]()
![]()