Monitorando a Floresta Amazônica


A cada levantamento são delimitadas as áreas de novos desflorestamentos, que são decalcadas em papel vegetal (overlays) (Figura 3), e sofrem uma rigorosa auditoria. Quando aprovados, os overlays são digitalizados e integrados a um Sistema de Informação Geográfica, que fornece a localização e extensão das áreas desflorestadas. Os dados digitais são convertidos para um formato que permite a apresentação do desflorestamento em qualquer divisão geográfica, por exemplo, tipos florestais, municípios etc. (Figura 4).

....

Monitoring the Brazilian Amazon Forest

At each assessment, the areas of new deforestation are delimited. The deforested areas are outlined in overlays (Figure 3), which are subject to a rigorous quality control. When approved, the overlays are scanned and integrated into a Geographical Information System to provide the location and extent of the deforested areas. The digital data are converted to a format that allows the presentation of deforestation in any geographical format, for instance, large vegetation classes, municipalities etc. (Figure 4).

_____________________________________________________________________________

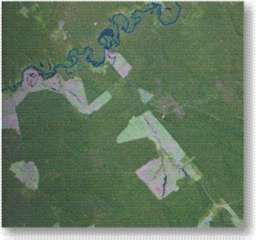
Figura 3a - Composição colorida falsa-cor utilizando
as bandas 3, 4, 5 do sensor TM do satélite Landsat.

Figure 3a - False color composite of using
bands 3, 4, 5 of the TM-Landsat

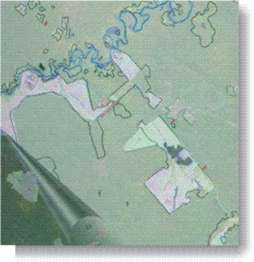
Figura 3b - Overlay correspondente à área da Figura 3a,
identificando os desflorestaentos observados até 1999 e os incrementos de desflorestamentos ocorridos no período de 999/2000

Figure 3b - Overlay corresponding to the area displayed in Figure 3a identifying the deforestations observed until 1999 and the increments of deforestation identified in the period 1999/2000
Figura 4 - Plotagem dos incrementos de
desflorestamento ocorridos no período 1999/2000.

Figure 4 - Plotted increments of deforestation
observed in the period 1999/2000.
 

                 Voltar / Back        Avançar / Go to page 7