|
Cerradão |
.... |
Dense Savanna Woodland |
_____________________________________________________________________________
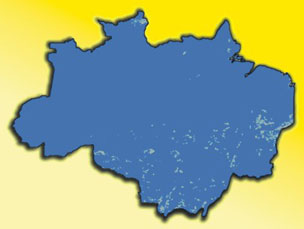
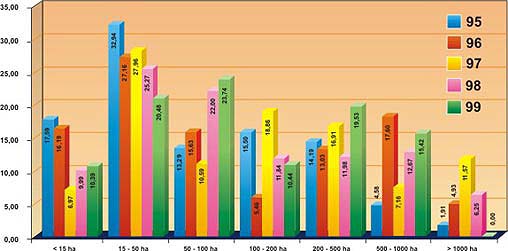
Figura 9c - Espacialização do Cerradão na Amazônia (figura acima) e
distribuição da taxa média do
desflorestamento bruto por classe de tamanho, de 1995 a 1999 (figura
abaixo).
Figure 9c - Geographical distribution of the Dense Savanna Woodland
in the Amazon contour map (figure above)
and distribution of the mean rate of gross deforestation by classes
of size, from 1995 until 1999 (figure below).
|
 |
|
|
* Relativo à taxa média anual do desflorestamento
bruto em Cerradão. |
|
|
 |